Data Points history and hourly graphs
When looking at your station’s details page, you can get the Rewards History and Map Overview. It would be useful to have a 3rd tab with Data Points History.
Right now we need to go on the map, click on the stations details and then switch to Data Points which is not really practical.
Also, I would really like to see a hourly graph for the current day. Something realtime.
It would help to debug if your station is working as expected or not.
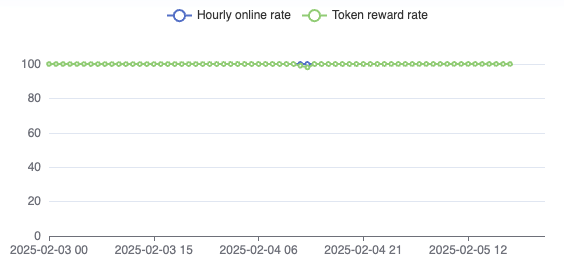
A graph kinda like this would be an idea. Updates every hour with the total data points sent during that hour.
The only way to debug this at the moment is to wait for the end of the day calculations and if you notice a drop, you can’t really know when it happened during the day so it’s hard to point out a potential issue.
This request was merged into another request
Comments2
Mike Wingbits
Feb 22, 2025
Oggle made a similar suggestion on the data points.
As for the online stuff, I think that is now handled in the Station’s Statistics page. What do you think? Keep in mind that will continue to expand… but at least do you think we are getting there?
User d98f32b7
Feb 22, 2025
Yes the new Statistics page is really useful! I made the suggestion before it was up and I guess it fixes the “issue”.
I guess we can close the post and continue with the one from Oggle for the Data Point History part